Introduction
According to Fortune Business Insights, the global cloud computing SaaS market is projected to have a CAGR of 18.4% between now and 2032 which should bode well for CC companies. This article highlights the 7 largest pure-play cloud computing SaaS software companies.
What is Cloud Computing?
Cloud computing (CC) is the technique of processing, storing, and managing data on a network of remote computers hosted on the internet by cloud service providers rather than on a personal computer or local server using only as much compute power and storage as needed to meet demand. This theoretically allows for cheaper and faster computing because it eliminates the need to purchase, install, and maintain servers.
What is SaaS?
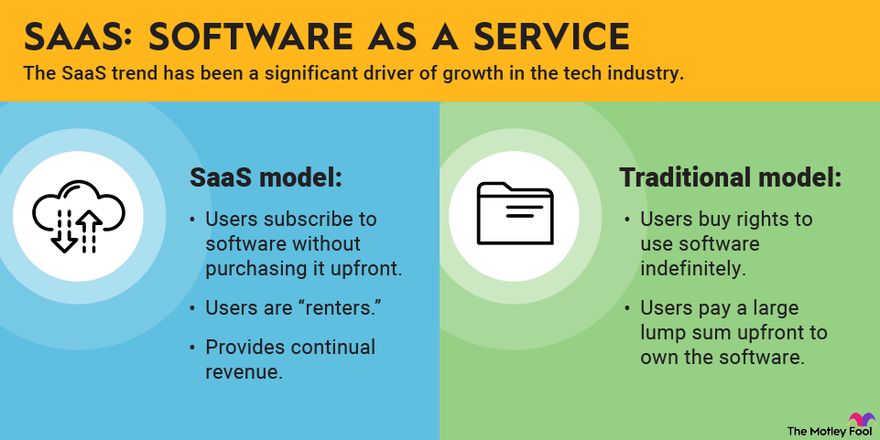
SaaS, also known as cloud application services, makes software available to users over the internet, usually for a monthly subscription fee. They are typically ready-to-use and are run from a users’ web browser which allow businesses to skip any additional downloads or application installations. SaaS accounts for 38.5% of cloud computing revenue. (Source) For more insightful information you are encouraged to read Cloud Computing 101.

Image source: The Motley Fool
What Is the PEG Ratio?
Given that growth is a key component of a stock’s expected return, the PEG ratio provides a simple way for investors to see how cheap a stock is relative to its growth rate and to compare a stock to its competitors.
The PEG ratio (price/earnings-to-growth ratio) builds upon the price-to-earnings (P/E) ratio by factoring in expected earnings growth. It takes into account not just the current earnings but also the company’s growth prospects. It is a quick calculation used to determine if a stock is trading at, above, or below fair value.
- A PEG ratio below 1.0 suggests that the stock price is undervalued relative to its expected future earnings growth. In other words, the market may not fully account for the company’s growth potential.
- Conversely, PEG ratios above 1.0 indicate that the stock price might be overvalued, as it isn’t necessarily supported by growth forecasts.
- Look for stocks with a PEG ratio below the industry median.
- The PEG ratio should be used along with the balance sheet, debt burden, and cash flow, or other valuation metrics that use the income statement. It’s also important to understand things like a company’s competitive advantage, its addressable market, and its long-term growth prospects.
- It’s a convenient rule of thumb but remember that the PEG ratio can vary based on earnings growth forecasts and the time frame being considered.
What is the Price-to-Sales Ratio?
The price-to-sales (P/S) ratio, which equals a company’s market capitalization divided by its annual revenue, is often used as a valuation metric for SaaS companies in place of the P/E ratio. A higher P/S ratio denotes optimism among investors that attractive revenue growth will continue and that the revenue will eventually generate profits.
Our Pure-Play Cloud Computing SaaS Stocks Portfolio
Below is a list of the 7 largest pure-play cloud SaaS software computing companies presented in descending order of their performances in October, their market capitalizations, their forward price-to-earnings and price/earnings-to-growth ratios and forward price-to-sales ratios with their ranks among their peers.
To determine why a particular stock advanced or declined so much last week click on the stock symbol and scroll down to the “News” section.
- Atlassian (TEAM): UP 16.9% in October
- Market Capitalization: $42B
- Forward Price-to-Earnings Ratio: 65.1 (Ranks #3)
- Price/Earnings-to-Growth Ratio: 2.57 (Ranks #3)
- Forward Price-to-Sales Ratio: 8.1 (Ranks #4)
- Overall Rank of Ratios: Tied for #3
- Please note that Atlassian delivered impressive first-quarter fiscal 2025 results on Friday, November 1st, surpassing market expectations and igniting a 19% stock rally by the end of the day.
- MongoDB (MDB): UP 1.9% in October
- Market Capitalization: $20B
- Forward Price-to-Earnings (P/E) Ratio: 104.4 (Ranks #6)
- Price/Earnings-to-Growth (PEG) Ratio: 7.35 (Ranks #7)
- Forward Price-to-Sales Ratio (PSR): 9.4 (Ranks #6)
- Overall Rank of Ratios: #7
- Workday (WDAY): DOWN 1.6% in October
- Market Capitalization: $63B
- Forward Price-to-Earnings Ratio: 31.6 (Ranks #1)
- Price/Earnings-to-Growth Ratio: 1.03 (Ranks #1)
- Forward Price-to-Sales Ratio: 6.9 (Ranks #2)
- Overall Rank of Ratios: #1
- HubSpot (HUBS): DOWN 1.9% in October
- Market Capitalization: $29B
- Forward Price-to-Earnings Ratio: 68.1 (Ranks #4)
- Price/Earnings-to-Growth Ratio: 2.68 (Ranks #5)
- Forward Price-to-Sales Ratio: 10.3 (Ranks #5)
- Overall Rank of Ratios: Tied for #6
- ServiceNow (NOW): DOWN 5.8% in October
- Market Capitalization: $195B
- Forward Price-to-Earnings Ratio: 60.2 (Ranks #2)
- Price/Earnings-to-Growth Ratio: 1.87 (Ranks #2)
- Forward Price-to-Sales Ratio: 15.4 (Ranks #2)
- Overall Rank of Ratios: #2
- Cloudflare (NET): DOWN 7.5% in October
- Market Capitalization: $30B
- Forward Price-to-Earnings Ratio: 117.1 (Ranks #7)
- Price/Earnings-to-Growth Ratio: 2.09 (Ranks #3)
- Forward Price-to-Sales Ratio: 15.9 (Ranks #1)
- Overall Rank of Ratios: Tied for #3
- Datadog (DDOG): DOWN 9.8% in October
- Market Capitalization: $42B
- Forward Price-to-Earnings Ratio: 74.2 (Ranks #5)
- Price/Earnings-to-Growth Ratio: 3.9 (Ranks #6)
- Forward Price-to-Sales Ratio: 14.1 (Ranks #3)
- Overall Rank of Ratios: Tied for #6
Summary
The above 7 pure-play cloud SaaS computing stocks had an average market capitalization of $55B, an average P/E of 74, an average PEG of 3.07 and an average PSR of 11.9. The model Portfolio went DOWN 4.6% in October. If Atlassian’s jump in price on November 1st can be maintained we could quite possibly see a reversal in the Portfolio over the next few weeks.
/Conclusion
According to Fortune Business Insights, the global cloud computing SaaS market is projected to have a CAGR of 18.4% between now and 2032 which should bode well for CC companies.


